Summary
Earlier this month, Datadog experienced a widespread outage. Coming out of the incident, we wanted to cover how you can prepare for similar outages in the future. Simply put, it’s important to:
Know when your observability provider is experiencing issues, as they occur
Have a backup plan for monitoring your applications until the service is restored
In this blog, we’ll discuss how you can minimize the impact of future incidents. Before diving in, let’s provide some background on Datadog's incident.
Datadog’s March 2023 Outage
On March 8, 2023, Datadog experienced an outage that affected several products. The outage lasted roughly 14 hours, and left many customers “flying blind."
We all know that outages happen within every technology, so the recent event is understandable. Moreover, observability providers’ Service Level Agreements (SLAs) leave room for unplanned downtime. For example, Datadog “maintains 99.8% availability of the hosted portion of the Service each month.” (99.8% availability equates to nearly 90 minutes of downtime each month.)
Given the critical nature of Datadog and other observability platforms, it’s important to:
Anticipate production issues before you need the platform
Have a backup plan if and when outages occur, so you can get by until the service is back online
How Edge Delta Supports Datadog Customers on a Normal Day
As we’ve covered before, Edge Delta can be integrated with your Datadog deployment (or virtually any other observability platform). Many customers begin using Edge Delta as a way to better control the log data you ingest into the platform. Additionally, our product automatically detects anomalies in real-time. An anomaly could be a spike in negative sentiment logs or an irregular metric.
This latter feature came in handy for many customers affected by the Datadog outage. Let’s dive into an example.
Detecting Datadog’s Outage as it Happened
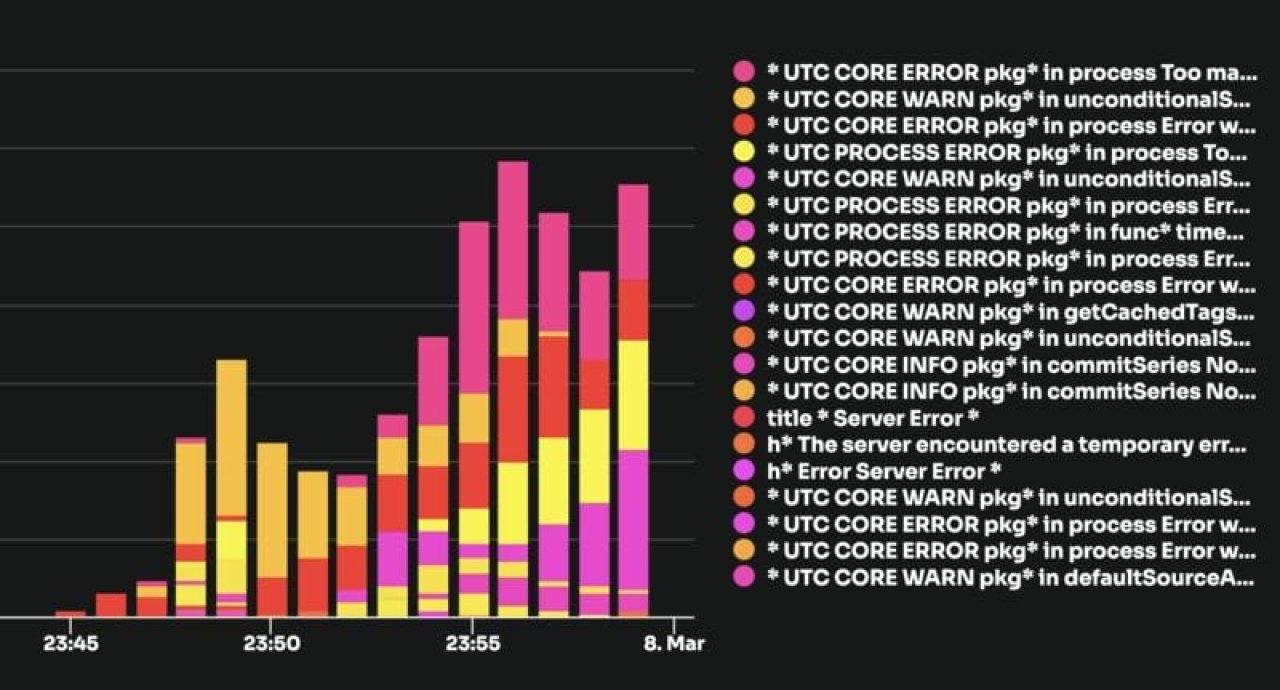
One of the customers affected by the Datadog outage was a media advertising company. This team had Edge Delta’s agent deployed alongside the Datadog agent. During the March 8 outage, Edge Delta was able to detect that there was an issue as soon as it occurred. Specifically, it picked up a spike in several core and process errors. These messages indicated Datadog’s issue.
As the customer explained, “Edge Delta picked up that Datadog was having an outage long before Datadog ever posted anything about it. So, that clued us in early that there was something going on.”
Even more helpful: the customer did not need to rely on rules-based alerting to detect the issue. This means they didn’t need to spend time building monitors, or even need to anticipate this issue in advance. Had they needed to do so, there’s a good possibility that the outage would’ve been missed.

Edge Delta detected Datadog's outage as it started. With this insight, customers could better prepare for the downtime.
You might be curious – how can Edge Delta provide this functionality while others can’t? It's expensive for traditional observability vendors to automatically analyze large volumes of log data. This is due to their architectures and resource-heavy components (e.g., Java).
Edge Delta, on the other hand, processes data as it's created at the source. This creates better efficiency and performance for analyzing unstructured log data.
With this functionality, you can prepare for potential downtime by using other tools for monitoring. That brings us to the second area Edge Delta can help.
Request a demo
Building Redundancy into Your Observability Stack
Knowing there’s an outage is one thing. But, how can your team monitor production applications until the issue is resolved? Edge Delta can help here, as well.
Edge Delta is not intended to be a one-to-one alternative to Datadog or the other major observability providers. But, it provides analytics capabilities and out-of-the-box dashboards that augment your observability provider. This includes:
Patterns, which help you easily interpret your logs and streamline troubleshooting processes
Kubernetes Overview, which maps out your environment and helps you gauge the health of your Kubernetes resources at a glance
Live Search, which provides complete access to your full-fidelity log data in Amazon S3
These features come in handy when you’re using Edge Delta as an observability pipeline. They're also helpful during an outage to your main provider. Edge Delta can help you:
Identify which logs you need to ingest
Determine which services are unhealthy and/or throwing the most data
Cost-effectively troubleshoot any issues
Conclusion
Typically, customers use Edge Delta to pre-process data and stream it to their observability platform. Since Edge Delta detects patterns in your log data in real time, it is helpful for both controlling cost and automatically surfacing production issues. Edge Delta can also come in handy during an outage, like the one experienced by Datadog on March 8, 2023.
Here, Edge Delta was used to notify customers of an issue with Datadog and serve as a backup observability tool for the duration of the outage. As a result, Edge Delta customers are positioned to deliver a great customer experience, regardless of the state of their primary observability platform.

