

A Day-in-the-Life Use of Anomaly Detection at the Edge
Our own Karl Evans previously covered why it’s important to use anomaly detection directly where your applications and services are running. If you haven’t already checked out his write-up, I recommend reading it.
Here at Edge Delta, we believe identifying anomalies in your machine data is critical to ensuring operational resilience. Furthermore, we believe this capability should be provided as any anomalies occur, not after they’ve already happened. That’s why we’ve built autonomous anomaly detection into every Edge Delta deployment, as well as intelligent anomalous data capture to provide context for troubleshooting.
Want Faster, Safer, More Actionable Root Cause Analysis?
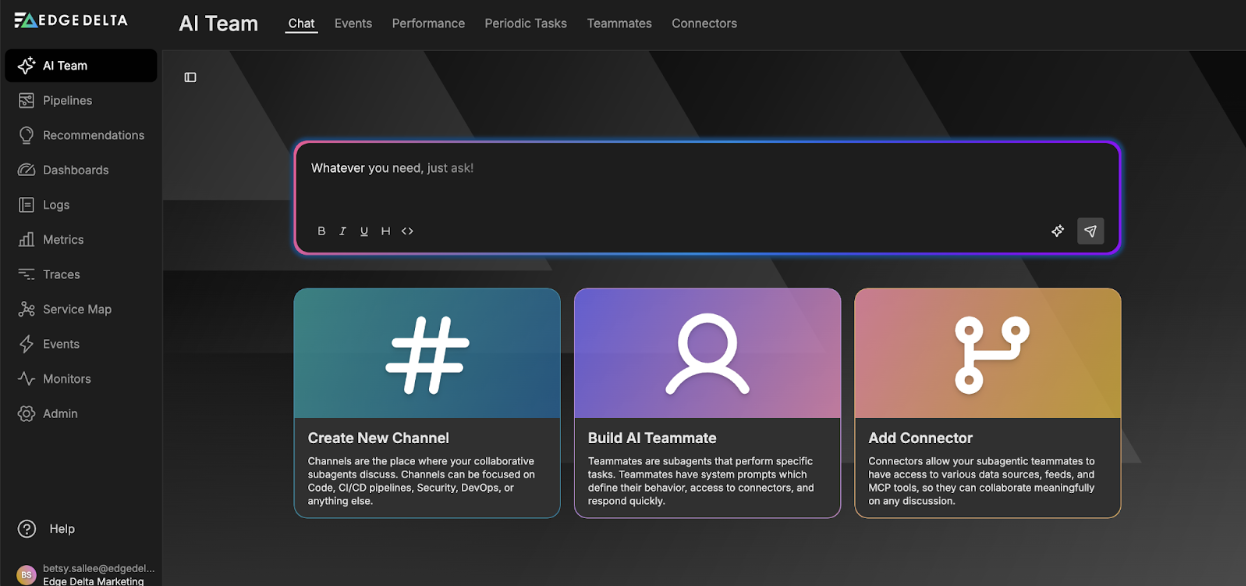
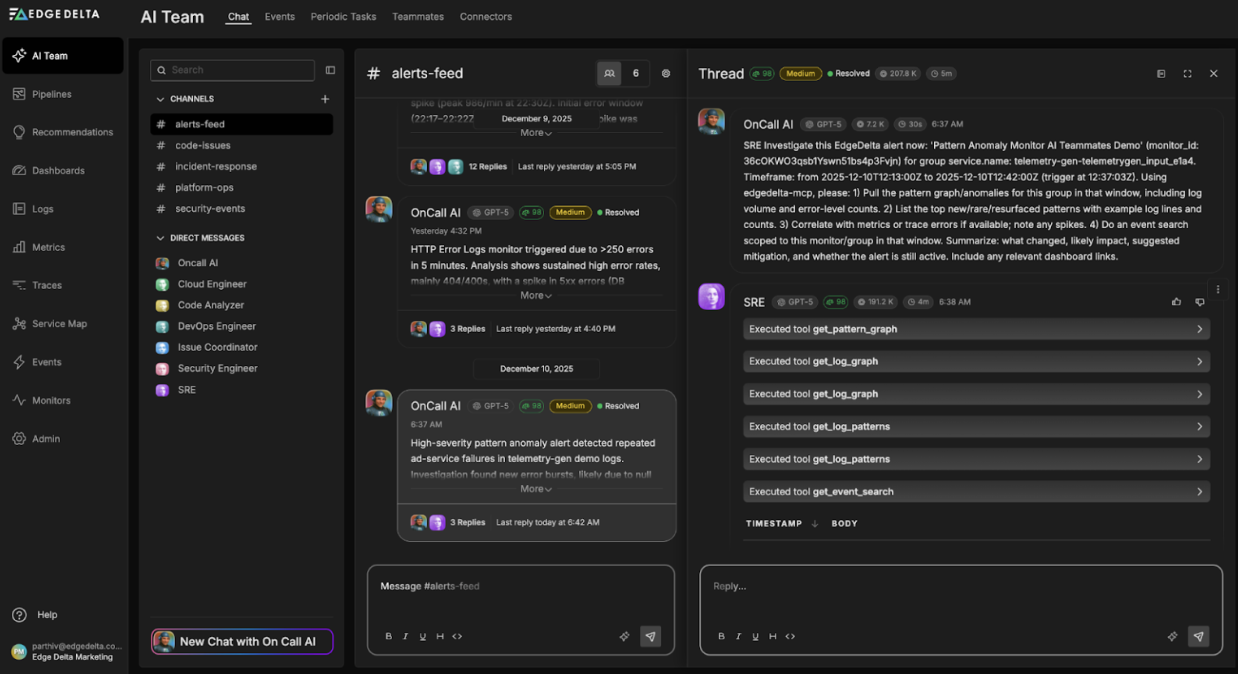
With Edge Delta’s out-of-the-box AI agent for SRE, teams get clearer context on the alerts that matter and more confidence in the overall health and performance of their apps.
Learn MoreAutonomous Anomaly Detection at the Source
Despite the efforts of many Site Reliability Engineering (SRE) and Situation Awareness Engineering (SAE) teams, issues often arise with production workloads. When these issues rear their ugly heads, most organizations try to mitigate the issue as fast as possible. Unlike typical observability models which rely on aggregated and centralized data, Edge Delta provides federated machine learning on data across distributed datasets in real-time. But just how “real-time” is our anomaly detection? Let’s take a look at an example of a recent incident in our own environment.
Like many organizations who rely upon Kubernetes to run workloads, the Edge Delta engineering team is no stranger to frequent environment updates. With our Edge Delta agent deployed natively as a daemonset to our internal Kubernetes clusters, we keep a constant watch of our own environments. Kubernetes-native event ingestion, coupled with our automatic event-to-metric capabilities make anomaly detection in any environment simple.
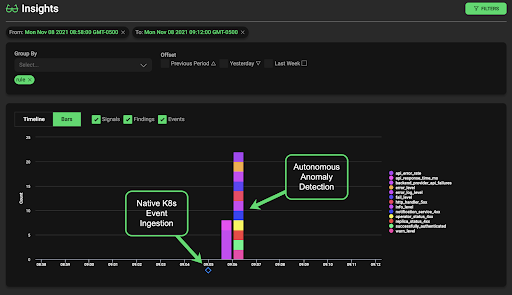
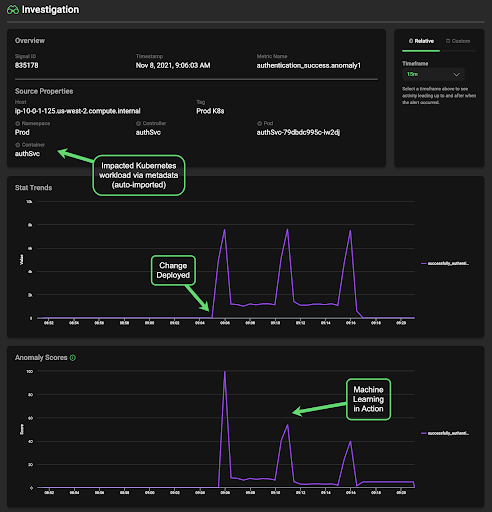
The above screenshot shows Edge Delta agents picking up a change in one of our Kubernetes environments, as well as multiple anomalies on our critical KPIs occurring only moments later. Notice the time it takes after the change for metric anomalies to be highlighted — only 1 minute! This time is critical to both operational efforts such as auto-remediation, as well as to the business itself.
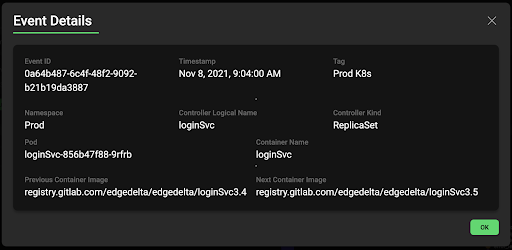
As we drill into the details of this particular change we know exactly what component(s) are impacted. In our case, a new image was deployed for the login service.
While multiple anomalies are a result of this change (many components rely on the login service), we can isolate just those originating from the pods where our login service runs. In particular, one of our SRE team’s golden signals for the entire authentication workload is authentication failures. Edge Delta constantly analyzes your organization’s KPIs for anomalies and uses a confidence algorithm to indicate how far out of normal a particular signal really is. This feature, Anomaly Score, uses machine learning to automatically eliminate noise from frequently occurring patterns.
Enabling Root Cause Analysis (RCA) with Anomaly Capture
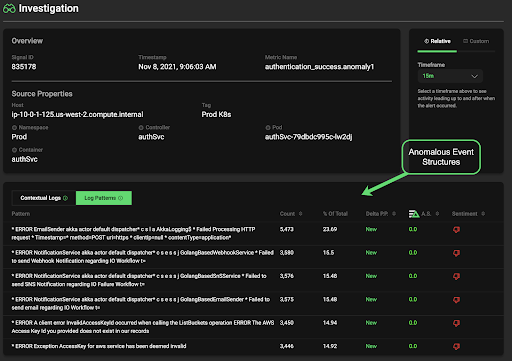
Whenever an anomaly with a particular degree of confidence occurs (default is 90% or higher), Edge Delta integrates into your observability practice by first collecting, and then streaming the raw data required to troubleshoot the issue directly to your existing analysis toolset (Splunk, Datadog, etc) . With Edge Delta Anomaly Capture, contextual raw event data is routed directly to your destination of choice. This data is kept in-memory by the agent, and is a circular buffer around the time the anomaly occurs (before and after). Along with the raw data is also the associated metadata and context of the anomaly, allowing precise RCA for issue without replacing your existing observability tool.
Check out our demo sandbox where you can play around with real data in a live environment. Feel like seeing Edge Delta in action with your own data? Feel free to deploy with ease in your own trial – sign up today!